The Calm Before the Calm
The Calm Before the Calm
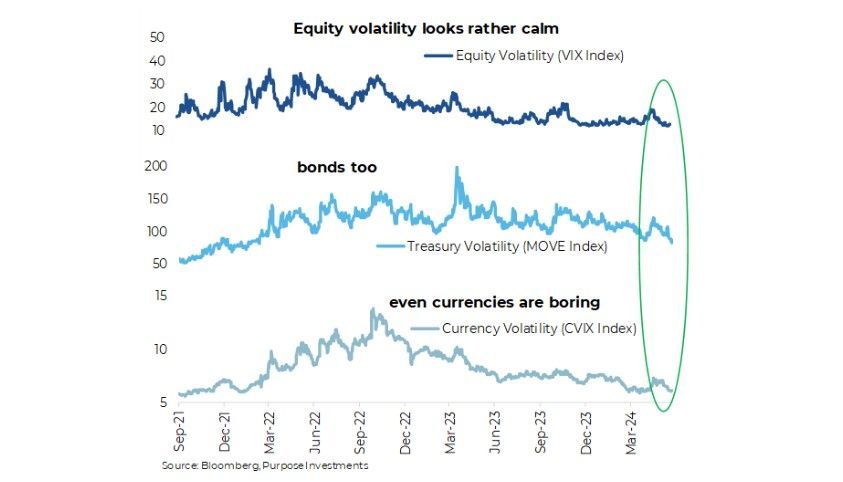
Should it be any surprise how calm markets have become? Global equities are up 9.2% year to date. Apart from a 2% decline in January and a 5% drop in April, the trend has been steadily up to the right on the chart. We can easily slap a financial narrative on this, such as improving economic growth globally, a decent Q1 earnings season, or maybe it's just the AI frenzy. More than a
third of the advances in global equities are attributed to Nvidia, Microsoft, Amazon, Meta, and Alphabet. Whatever the cause, equity volatility has been very calm so far in 2024. But it is more than this, as it isn’t just equities.
The volatility in the bond market has gone super low (2nd panel in chart). The MOVE index measures volatility in U.S. Treasury Bonds [actually at-the-money options on interest rate swaps, but let’s not go down that rabbit hole]. Even though bond yields moved higher this year, the 10-year started at 4%, gradually up to 4.75%, then back down to 4.5%; these moves pale in comparison to the last couple of years. In case you forgot, the same bond in 2022 went from 1.5% to 4.0% and in 2023, yields oscillated between 3.5 to 5.0%. Looking beyond Treasuries, credit spreads are back down to or close to historical lows. Investment Grade spreads in the U.S. are 50bps. Lows in past mini-credit cycles have been 40-60bps.

Then, finally, there are currencies. Again, volatility has been sitting near or at lows for the past number of years. After the rollercoaster currency rides in 2020-2022, a calmness has returned. The U.S. trade-weighted dollar index has been sitting in a channel between 100 and 107 for a year and a half. The Canadian dollar, too – 72-75 cents has been the range since the end of 2022.
Yawn.
Or consider this: the S&P 500 has not had a 2% down day in 316 trading sessions dating back to February 2023. Third longest streak this millennium. Given this, it is not too surprising the VIX, which measures the implied volatility of S&P index options, is sitting down at 12 ½. The VIX uses near-term options for its measurement of volatility; even more surprisingly, the six-month VIX is dormant. Over the next six months, we will have endured a U.S. election (if it ends as scheduled) and perhaps a pivot from the Fed on interest rates. Even 5-6% out-of-the-money puts for December are only pricing in 16% volatility.
Insurance is cheap.
There is likely some downward pressure on option volatilities due to the proliferation of option strategies, especially those that write options. But given volatility has become so calm across so many markets and asset classes, we can’t really blame those yield-hungry investors.
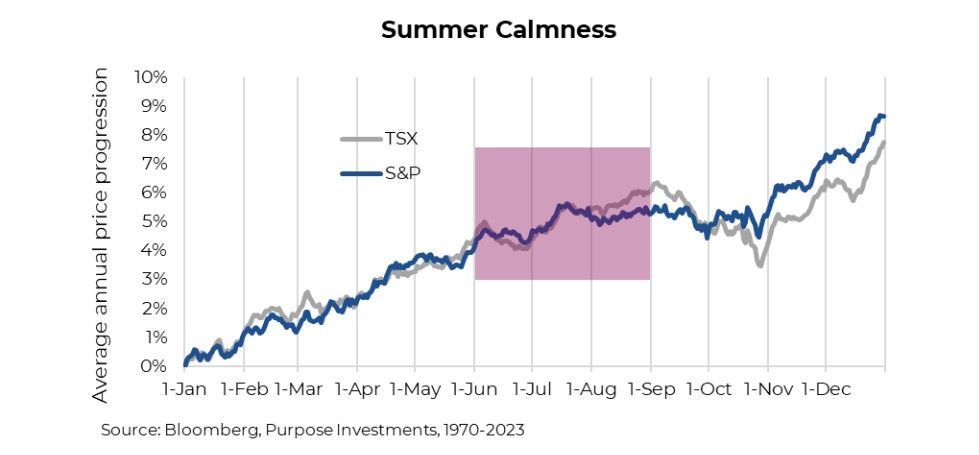
The question becomes, will this calmness persist? Maybe. There is no denying that, on average, markets tend to be relatively calm during the summer months (June through the end of August). All the traders/investors off in the Hamptons, Muskoka or wherever the Londoners go could make volumes lower and have fewer folks making big changes to their portfolios. Of course, averages can be very misleading and much variation can occur. With data back to 1970, the summer months are roughly flat on average for the S&P and the TSX. A seasonal chart for the VIX also shows this calmness as volatility falls in the summer months before moving
materially higher in the often challenging September/October period.

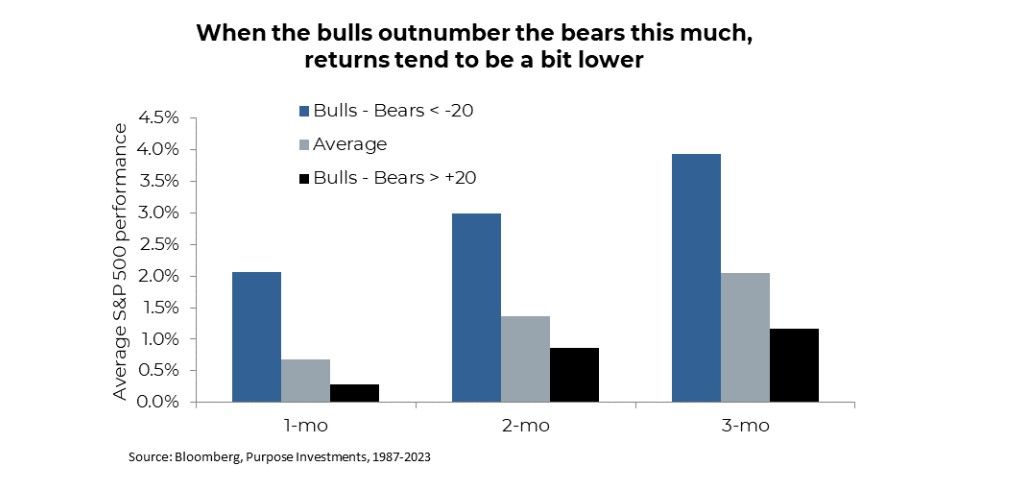
Not surprising that markets are gently trending higher with limited volatility; investors have become rather calm as well. In the latest survey, 47% of folks are bullish (AAII survey). Meanwhile, 26% are bearish, and 27% are neutral or undecided. We would highlight that from a sentiment perspective, when this many folks are bullish, future returns tend to be a bit on the lower side. But we will also point out that sentiment is much more reliable at market bottoms than trying to call market tops.

New Paragraph


